Financial Information
Summary Statement of Financial Position
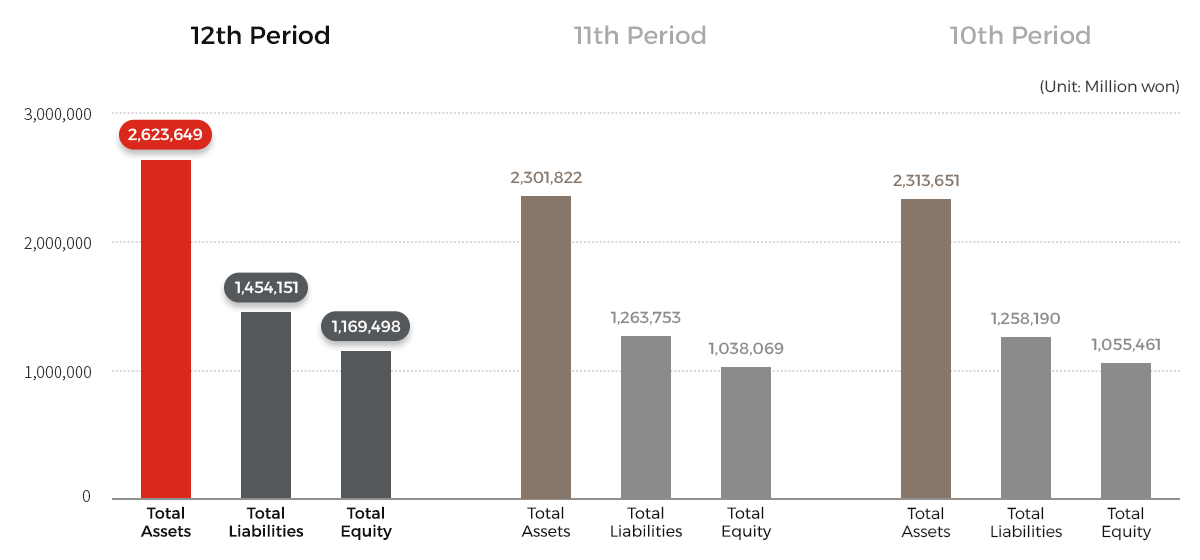
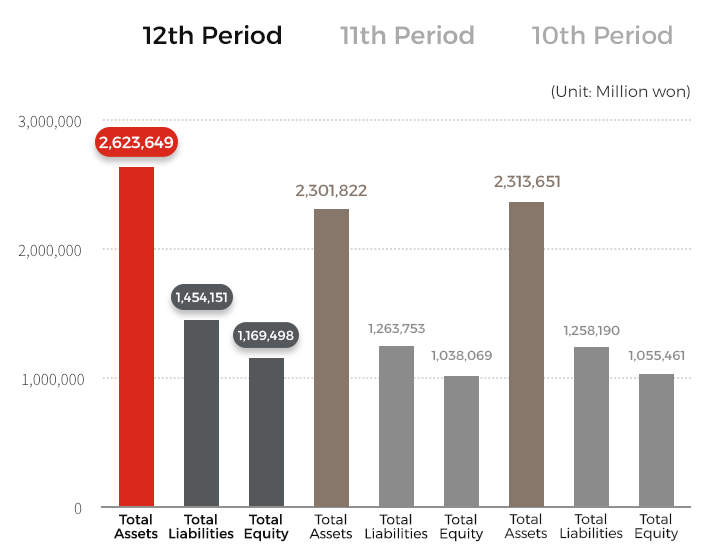
(Unit: million won)
| 14th Period (As of Dec 31, 2025) |
13th Period (As of Jun 30, 2025) |
12th Period (As of Dec 31, 2024) |
|
|---|---|---|---|
| Current Assets | 58,449 | 57,761 | 40,918 |
| Non Current Assets | 2,535,958 | 2,554,183 | 2,582,730 |
| Total Assets | 2,594,407 | 2,611,944 | 2,623,649 |
| Current Liabilities | 621,337 | 358,735 | 470,628 |
| Non Current Liabilities | 833,571 | 1,099,529 | 983,523 |
| Total Liabilities | 1,454,908 | 1,458,264 | 1,454,151 |
| Share Capital | 144,484 | 144,484 | 144,484 |
| Capital Surplus | 1,179,576 | 1,179,576 | 1,179,576 |
| Retained Earnings | (184,562) | (170,380) | (154,563) |
| Total Equity | 1,139,499 | 1,153,680 | 1,169,498 |
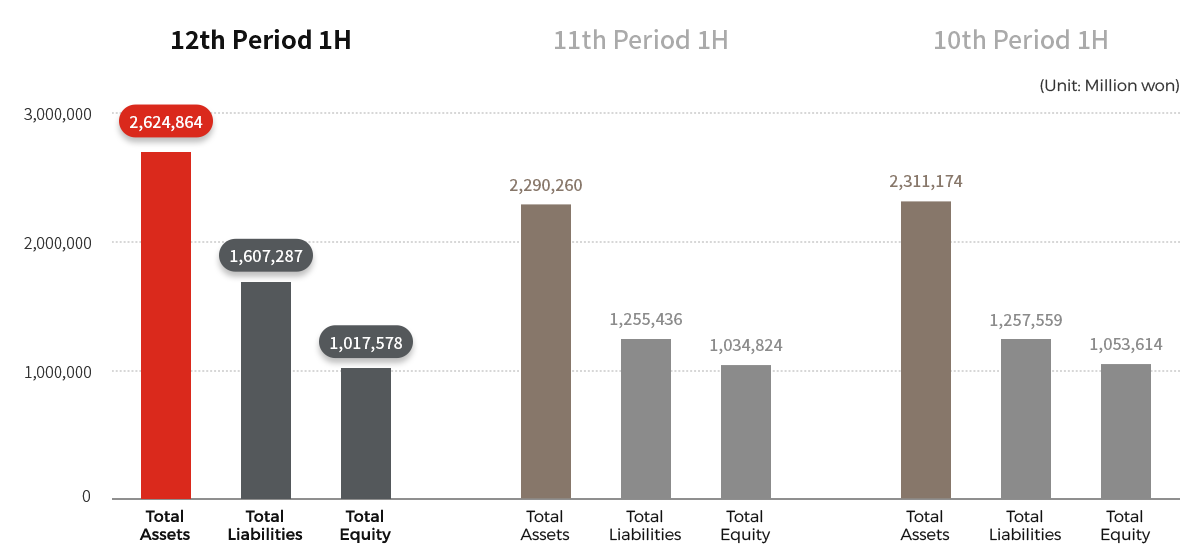
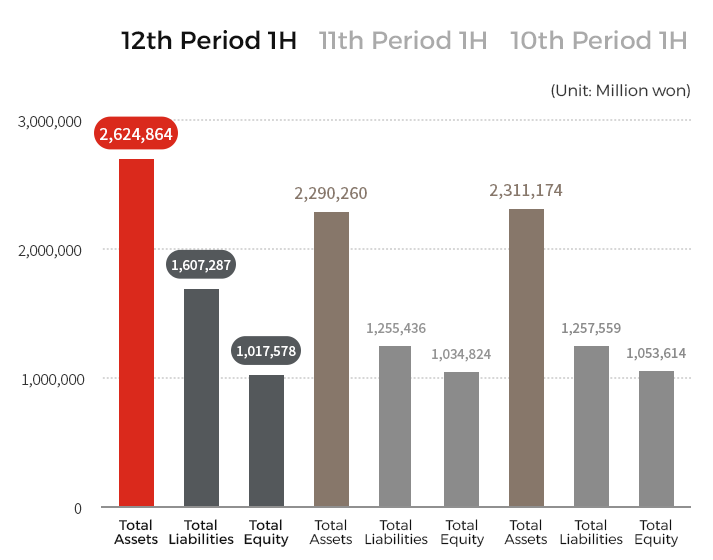
(Unit: million won)
| 14th Period 1H (As of Sep 30, 2025) |
13th Period 1H (As of Mar 31, 2025) |
12th Period 1H (As of Sep 30, 2024) |
|
|---|---|---|---|
| Current Assets | 69,843 | 25,154 | 33,021 |
| Non Current Assets | 2,545,671 | 2,572,795 | 2,591,843 |
| Total Assets | 2,615,514 | 2,597,949 | 2,624,864 |
| Current Liabilities | 707,618 | 671,513 | 386,971 |
| Non Current Liabilities | 778,318 | 780,828 | 1,220,316 |
| Total Liabilities | 1,485,935 | 1,452,341 | 1,607,287 |
| Share Capital | 144,484 | 144,484 | 121,484 |
| Capital Surplus | 1,179,576 | 1,179,576 | 1,056,735 |
| Retained Earnings | (194,482) | (178,453) | (160,642) |
| Total Equity | 1,129,579 | 1,145,608 | 1,017,578 |
Summary Income Statement
(Unit: million won)
| 14th Period (Jul 1, 2025 ~ Dec 31, 2025) |
13th Period (Jan 1, 2025 ~ Jun 30, 2025) |
12th Period (Jul 1, 2024 ~ Dec 31, 2024) |
|
|---|---|---|---|
| Operating Revenues | 70,880 | 69,954 | 65,629 |
| Operating Expenses | 24,625 | 24,730 | 23,623 |
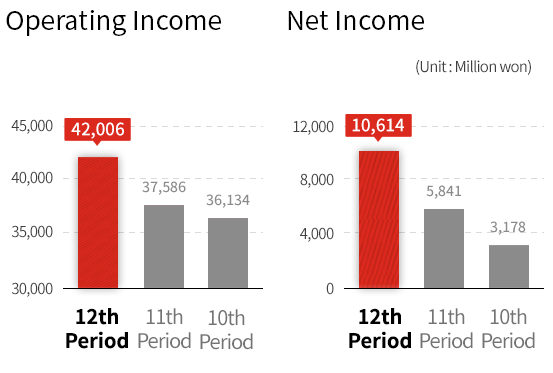
| Operating Income | 46,255 | 45,224 | 42,006 |
| Non-operating Revenues | 726 | 1,270 | 464 |
| Non-operating Expenses | 27,353 | 29,947 | 31,856 |
| Net Income | 19,627 | 16,547 | 10,614 |
(Unit: million won)
| 14th Period 1H (Jul 1, 2025 ~ Sep 30, 2025) |
13th Period 1H (Jan 1, 2025 ~ Mar 31, 2025) |
12th Period 1H (Jul 1, 2024 ~ Sep 30, 2024) |
|
|---|---|---|---|
| Operating Revenues | 35,267 | 35,204 | 30,872 |
| Operating Expenses | 12,221 | 12,574 | 11,343 |
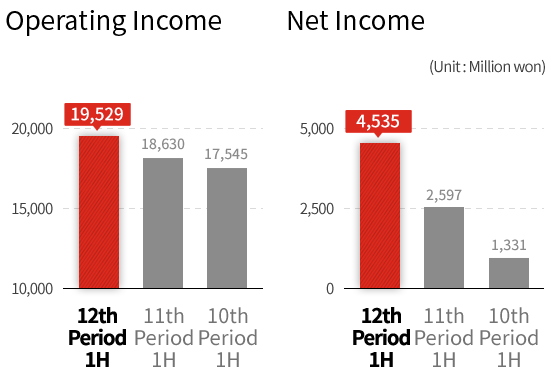
| Operating Income | 23,046 | 22,630 | 19,529 |
| Non-operating Revenues | 359 | 1,095 | 264 |
| Non-operating Expenses | 13,698 | 15,251 | 15,259 |
| Net Income | 9,708 | 8,474 | 4,535 |
Dividend Information
(Unit: million won)
| 14th Period (Jul 1, 2025 ~ Dec 31, 2025) |
13th Period (Jan 1, 2025 ~ Jun 30, 2025) |
12th Period (Jul 1, 2024 ~ Dec 31, 2024) |
|
|---|---|---|---|
| Net Income | 19,627 | 16,547 | 10,614 |
| Depreciation Expenses (Excess Dividend) |
15,916 | 17,262 | 17,551 |
| Additional paid-in capital transfer |
0 | 0 | 4,200 |
| Total Dividends | 35,543 | 33,809 | 32,365 |
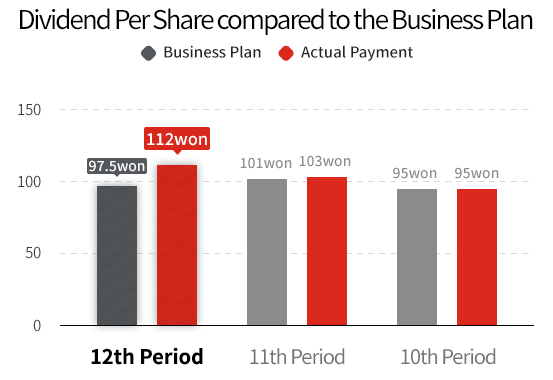
| Dividend per Share (won) | 123 | 117 | 112 |
| Dividend Payout Ratio | 181.09% | 204.32% | 304.92% |
※ According to Article 28 (3) of the Real Estate Investment Company Act,
a REIT may pay dividends in excess of its profits within the scope of the depreciation
expenses for the relevant year
※ Total dividends incorporate additional paid-in capital transfer
Credit Ratings
| Category | Rating Agency | Rating Type | Rating | Out look |
Date of Rating |
|---|---|---|---|---|---|
| Secured Bond (Sixth(1nd)) |
Korea Investors Service | Regular | AA- | Stable | Apr 7, 2025 |
| NICE Investors Service | Regular | AA- | Stable | Apr 28, 2025 | |
| Secured Bond (Sixth(2nd)) |
Korea Investors Service | Regular | AA- | Stable | Apr 7, 2025 |
| NICE Investors Service | Regular | AA- | Stable | Apr 28, 2025 | |
| Secured Bond (Seventh(1nd)) |
Korea Investors Service | Regular | AA- | Stable | Apr 7, 2025 |
| NICE Investors Service | Regular | AA- | Stable | Apr 28, 2025 | |
| Secured Bond (Seventh(2nd)) |
Korea Investors Service | Regular | AA- | Stable | Apr 7, 2025 |
| NICE Investors Service | Regular | AA- | Stable | Apr 28, 2025 | |
| Secured Bond (Eighth) |
Korea Investors Service | Main | AA- | Stable | Apr 7, 2025 |
| NICE Investors Service | Main | AA- | Stable | Apr 7, 2025 |